Weather Info
Charlie Elliott WC
![]()
33°28'09"N -83°44'06"W
The Dutch Observatory
![]()
+33°39’15.4” N -83°54’17.6” W
Jetstream Forecast
12 Hour Forec. -- 60 Hour Loop

![]()
![]()
![]()
| M | T | W | T | F | S | S |
|---|---|---|---|---|---|---|
| « Nov | ||||||
| 1 | 2 | 3 | 4 | 5 | ||
| 6 | 7 | 8 | 9 | 10 | 11 | 12 |
| 13 | 14 | 15 | 16 | 17 | 18 | 19 |
| 20 | 21 | 22 | 23 | 24 | 25 | 26 |
| 27 | 28 | 29 | 30 | 31 | ||
The Sun Today

Pages
Past Posts
Blogroll
- Anthony Wesley, Australia
- CE-Astronomy Blog
- Christopher Go, Philippines
- Damien Peach, UK
- Jon Wood
- Larry Owens
- Oliver Pettenpaul, Germany
- Paul Tankersley
- Ray Major
- Rich Jakiel
- Richard Bosman, Netherlands
- StePHen Ramsden
- Tim Geib
Go Curiosity Go!

January 23, 2021 on 9:23 am | In Papers | Comments Off
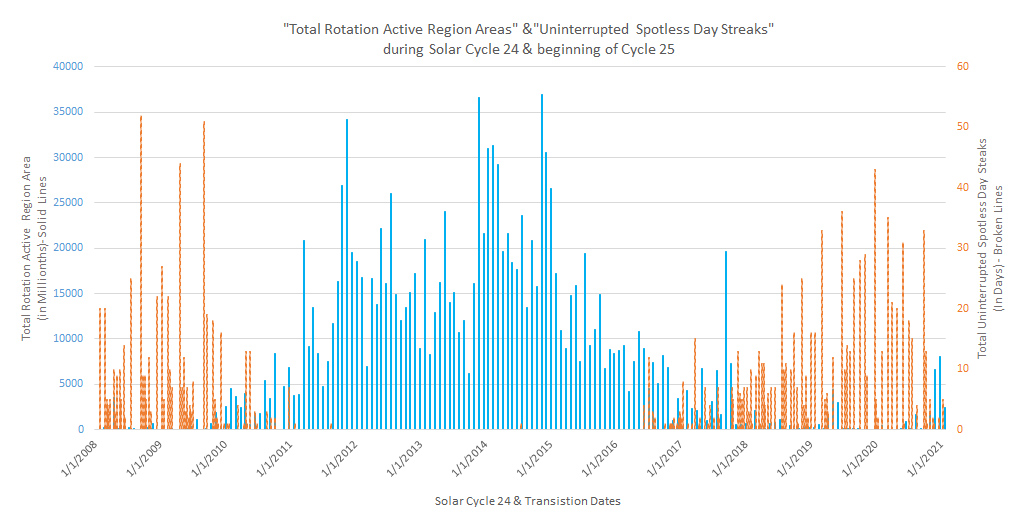
I was asked if it was true that it seemed that Cycle 25 activity ramped up faster than previous rotations. In order to try to shed some light into this, I am providing two graphs. It is noted here that each graph, while created by me, is based on data provided in the daily GEOalert notifications from NOAA’s Spaceweather Prediction Center (SWPC). Clicking on the graphs here will show the full size graphs for better viewing. Each graph shows the value of the sum of all daily active region areas for a Rotation since January 1, 2008 (Blue lines, mostly in the middle, with their scale on the left). Also shown is the number of spotless days. (red lines at the side with the scale on the right). The difference between the two graphs is that one of them shows the number of consecutive spotless days at the end of this spotless period (Streak).

The second graph shows the number of spotless days by ROTATION at the last day of the rotation The number of these days reported by the size of the bars in this graph, don’t have to be consecutive, but the reported value is shown for an equal time period for all (one rotation). The Minimum for Cycle 23/24 (Beginning of Cycle 24) was in December of 2008. The Minimum for Cycle 24/25 (Beginning of Cycle 25) was during December of 2019, giving a cycle duration of 11 years. It is clearly seen that the blue lines (indicating Solar Activity) don’t start showing in 2009, one year following the minimum , but this cannot be said for 2020, a year after the next minimum. We surely see noticeable activity during the end of 2020. In addition, the Total Active Region Areas by Rotation show a higher value now than during the beginning of the previous solar minimum. In fact the Total Active Region Area by Rotation did not exceed 5000 millionths until August 9, 2010, or 20 months after the previous minimum. For the current Cycle, November 27, 2020 marks the first time where the 5000 millionths barrier was broken, and by well over 1000 millionths, which is only 11 months. So to summarize the results so far, Cycle 25 seems to gain in activity much faster than Cycle 24 did. We are eager to learn if this fast ramp up will continue.

January 13, 2021 on 2:39 pm | In Papers | Comments Off
During the ALPO meeting in the Fall of 2019 I made a presentation about solar activity since 1874. As part of that I presented the results of my research and statistics during Solar Cycle 24. Now, where we have entered Cycle 25, I’d like to update three of the graphs that I used in this presentation. Please click on the images to see the full size chart. The first one shows the “Total Active Region Areas for the rotation”, and the “uninterrupted Spotless day streaks” from 2008 until current. Here is the updated chart.

The second graph shows for the same time period the monthly Ri (Wolf number) as reported by SILSO, as well as the number of consecutive spotless day streaks for the given period.

Finally for the same time period, I show the graph showing for every day the sum of the value of >R2 classified Flares (>M5, added as numeric values) as well as the distribution of the value of spotless day streaks.

One can clearly see the long period of spotless days of 43 days ending in December of 2019, which was determined by SWPC and SILSO as the Solar minimum for the Cycle 24 – Cycle 25 transition.
October 6, 2020 on 10:35 am | In Papers, Sun | Comments Off
Today a follow up on the analysis I did regarding the reverse polarized areas during the Solar Minimum over the last four years. I did publish several reports about this during the time I was working on this, but I don’t believe that the complete list is still accessible on the internet. The first area I detected was on December 21, 2016 and I stopped recording them in my summary, when Cycle 24 polarized areas became very few at the end of February 2020. Click on the link below to see or download the overview.
http://ceastronomy.org/tramakers/wp-content/uploads/2020/09/2020-04-xx-RevPolarized.pdf

May 18, 2020 on 5:12 pm | In Papers, Sun | Comments Off
An Analysis of the Transition From Solar Cycle 24 to Solar Cycle 25
I wrote a paper about the current Solar low. More specifically how the current transition stacks up against transitions between other Solar Cycles. This paper was published in the 2020 Winter issue of the Strolling Astronomer, ALPO-Astronomy’s quarterly paper. I am posting it here for those who follow me, and have not had a chance to read this, so they can get a better idea what the current Solar minimum indicates. Follow the link here to read the paper as a pdf document.
![]()
Entries and comments feeds. Valid XHTML and CSS. ^Top^ Powered by WordPress with jd-nebula-3c theme design by John Doe.