January 13, 2021 on 2:39 pm | In Papers | Comments Off
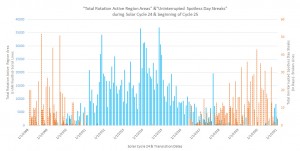
During the ALPO meeting in the Fall of 2019 I made a presentation about solar activity since 1874. As part of that I presented the results of my research and statistics during Solar Cycle 24. Now, where we have entered Cycle 25, I’d like to update three of the graphs that I used in this presentation. Please click on the images to see the full size chart. The first one shows the “Total Active Region Areas for the rotation”, and the “uninterrupted Spotless day streaks” from 2008 until current. Here is the updated chart.
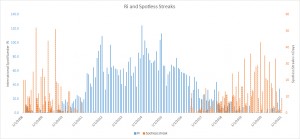
The second graph shows for the same time period the monthly Ri (Wolf number) as reported by SILSO, as well as the number of consecutive spotless day streaks for the given period.
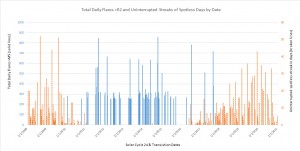
Finally for the same time period, I show the graph showing for every day the sum of the value of >R2 classified Flares (>M5, added as numeric values) as well as the distribution of the value of spotless day streaks.
One can clearly see the long period of spotless days of 43 days ending in December of 2019, which was determined by SWPC and SILSO as the Solar minimum for the Cycle 24 – Cycle 25 transition.
Entries and comments feeds. Valid XHTML and CSS. ^Top^ Powered by WordPress with jd-nebula-3c theme design by John Doe.


